|
|
Wave Information Study
|
|
|---|
WIS Data Portal Updates
Portal Updates 2.0 (2026)
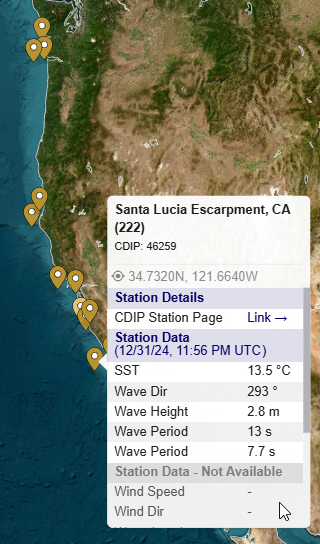
- CDIP Buoys are now live on the WIS Portal. Once enabled, pins for presently active buoys will show on the map. If the user hovers over the point, a dialog will show with the latest data and a link to the CDIP page.
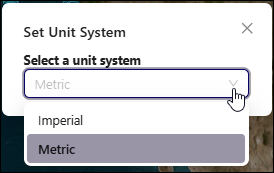
- Most tables and plots now are displayed with either imperial or metric units, depending on the user's selection on the WIS Data Portal. The exceptions are: 2d Spectra and entries in the Input for Models category which remain intact.
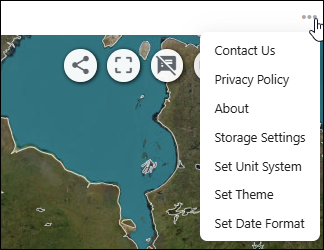
To change the selection, open the Portal Menu (three horizontal dots) and select 'Set Unit System'.
- The "WIS Export" section is now renamed to "Product Catalog". It now opens immediately after any station or buoy has been selected.
-
If a new selection is made, the catalog automatically updates to the correct page.
- The Extremes Analysis table and plot options have been enhanced to provide Wind Speed analysis as well as Wave Height.
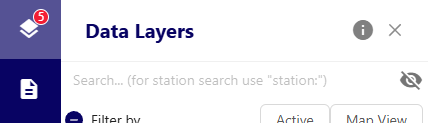
- Slight changes to the search feature in the Data Layers section.
- To search for a specific station or buoy, you must type station: before entering the search string.
- Otherwise, the site searches through the layers.
To change the selection, open the Portal Menu (three horizontal dots) and select 'Set Unit System'.
- If a new selection is made, the catalog automatically updates to the correct page.
- To search for a specific station or buoy, you must type station: before entering the search string.
- Otherwise, the site searches through the layers.
Additional changes are coming soon, so stay tuned!
Portal Refresh (2025)
A major update to the underlying architecture for the portal has been implemented. The new portal has the following benefits:
- Faster loading of stations and processing background scripts for data retrieval.
- Better viewing experience on smaller displays/tablets.
- Allows a larger range of future enhancements to the interface.
- Share your current view with teammates through use of a permalink.
- Extremes Analysis and Mean-Max tools have been reworked to be significantly faster. Instead of taking 500-800 seconds, the first-time each tool is run now should take less than 15 seconds. A cache of these files is kept for future need to make it even faster.
Click the ▶ icon next to each option below for additional guidance.
Zoom into a specific station/buoy
- Open Data Layers option in left navigation menu to change visibility of available regions (WIS/Buoys)
- Enter a station name in the space above the "Filter by" option
- Note the region(s) remaining below, then look in that region's area in the main view for the pin(s) which match the filter value
- Click the desired pin for access to the data products
Icons on Upper Right
 - Share the exact view with others using a Permalink (URL)
 - Screenshot with legend
 - Activate Hover Tooltip: gives additional information about station/buoy pins.
 - Measure Distances using the System Units
 - Zoom to rectangle drawn by user
 - Legend
 Addition of NDBC Buoy option to the CIRP CMS-Wave Tool
Presently the CMS-Wave tool within the WIS Data Portal only works for WIS estimate stations. We have added new capability to use this tool with available NDBC Buoy data as well. When using this tool with NDBC data, the user should understand that there may be data gaps within the returned data files. WIS makes No attempt to fill these gaps. This NDBC version of the tool is now in a beta status. Please let us know if there are any issues.
Note: While we had also hoped to introduce this tool for Canadian MEDS buoy data, unfortunately their data does not include Mean Wave Direction which prevents a valid spectra from being defined.
Added capabilities to the API
We have added a feature that allows the user (or software) to send bounding box information to the API to obtain a list of stations and buoys (and corresponding information) contained within that region.
- Initial use for this capability will be to allow for integration into the Surface-water Modeling System to search for WIS Portal data/estimates.
- A link and basic information on the API is given here .